Chapters
The Amortization worksheet
The Amortization worksheet breaks a loan down payment by payment, so you can see how each instalment splits between interest and principal, and what you still owe at any point along the way. It answers the questions a plain payment figure hides: how much of this year's payments actually paid down the debt, how much went to the lender as interest, and what the balance will be once a given stretch of payments is behind you.
You reach it from the Financial calculator's Worksheets view: switch the calculator to Worksheets and choose the Amortization tab from the tab strip (TVM · Cash Flow · Amortization · Bond · Depreciation · ...). It shares its loan setup with the TVM worksheet - the two are views of the same underlying loan - so most of the time you set the loan up once on the TVM tab and simply read the breakdown here.
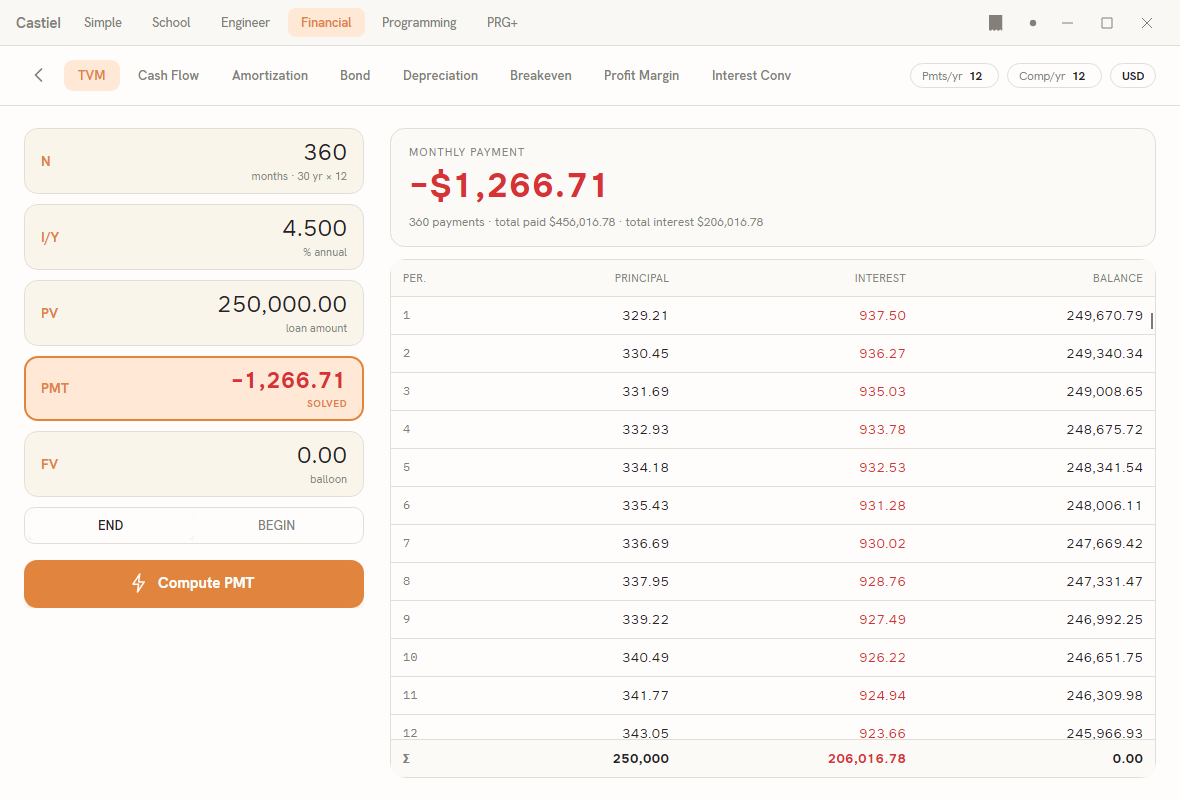
The tab has two parts. On the left is a short range form: two fields, P1 and P2, a Compute range button, and three result cards that appear once you compute. On the right is the full per-period schedule - one row for every payment of the loan, with a running balance, and a totals row at the foot. The left side answers "what happened across these payments"; the right side lays out the whole loan at once.
Where the numbers come from: the shared loan
The Amortization worksheet does not hold its own loan. It reads the same five loan values the TVM worksheet uses:
N- the total number of payments (for a 30-year monthly mortgage,360).I/Y- the interest rate per year.PV- the present value: the amount borrowed.PMT- the payment made each period.FV- the future value (for a loan fully paid off,0).
together with the header chips Pmts/yr (P/Y) and Comp/yr (C/Y), which set how many payments fall in a year and how often interest compounds.
Set these up first. The usual route is the TVM tab: enter the four figures you know and solve for the fifth (typically PMT). The moment a complete, consistent loan exists, the schedule on the right of the Amortization tab fills in automatically - you do not press anything to build it. Until then, the schedule shows a prompt: "Store N, I/Y, PV and solve PMT to populate the schedule." A schedule needs a whole number of payments and a non-zero payment to exist; a half-finished setup leaves it blank.
Because the loan is shared, editing it anywhere updates everything. If you change a TVM figure, re-solve the payment, or store a new value from the keypad, the schedule rebuilds - and any range result you had computed clears itself, rather than sit on screen describing a loan that no longer exists. Compute the range again after a change.
The per-period schedule (the right pane)
The right pane is the loan written out in full, one row per payment. Its four columns are:
| Column | What it shows |
|---|---|
PER. |
The payment number, 1 for the first payment through to N for the last. |
PRINCIPAL |
The part of that payment that reduced the debt. |
INTEREST |
The part of that payment that went to interest (shown in a distinct tint). |
BALANCE |
The amount still owed after that payment. |
Read down the INTEREST and PRINCIPAL columns and you see the characteristic shape of an amortized loan: early payments are mostly interest with only a sliver of principal, and the mix tips steadily the other way until, on the final row, the payment is almost all principal and the BALANCE lands on 0.00.
The pane scrolls, so a long loan (a 360-row mortgage) is fully there - scroll to walk through it payment by payment. At the foot, a totals row marked Σ sums the whole schedule: total principal repaid (which equals the amount borrowed), total interest paid over the life of the loan, and the ending balance. For a loan that pays off cleanly, the ending balance is 0.00 and the total principal equals PV; the total interest is the true cost of the borrowing.
Money is shown to two decimal places with your chosen currency symbol and digit grouping (for example $1,266.71); a negative amount is written with a leading minus sign before the symbol.
Computing a range: P1 to P2
Often you do not want the whole loan - you want a stretch of it. "How much interest did I pay in the first year?" "What will I still owe after five years of payments?" The range form on the left answers exactly that.
Enter the first payment of the stretch in P1 and the last payment in P2, then press Compute range. The fields start at 1 and 12 - the first twelve payments, i.e. the first year of a monthly loan - which is the most common thing to ask for. To cover the first year set P1 = 1, P2 = 12; for the second year, P1 = 13, P2 = 24; for a single payment, set both to the same number.
When you compute, three cards appear:
- A balance card, headed with the range you asked for (for example
PAYMENTS 1–12), showing the balance after the range - what you still owe once paymentP2has been made. - A
PRINCIPALcard - the total principal repaid across paymentsP1throughP2. - An
INTERESTcard - the total interest paid across the same payments (styled to match the interest column in the schedule).
The principal and interest cards show the amounts you actually paid over the range, as positive magnitudes, so they line up with the way the schedule columns read.
If the range is not valid, a short message appears instead of the cards and nothing is computed:
- Both fields must be whole numbers with
1 ≤ P1 ≤ P2; otherwise you see "Enter a whole payment range with 1 <= P1 <= P2". P2cannot run past the end of the loan. If it exceeds the stored number of payments you see "P2 exceeds the stored N (… payments)", naming theNyou have.
Fix the range and press Compute range again.
Worked example: the first year of a mortgage
Suppose you borrow 250,000 at 4.5% a year, repaid with monthly payments over 30 years. You want to know, for the first year, how much went to interest versus principal, and what you will still owe at the end of it.
Set the loan up (TVM tab). Enter N = 360 (30 years × 12 payments), I/Y = 4.5, PV = 250000, FV = 0, and make sure the header chips read P/Y = 12 and C/Y = 12. Solve for the payment: it comes out near −$1,266.71 a month (shown negative because it is money leaving your pocket). As soon as the loan is complete, the schedule appears on the Amortization tab, and its Σ totals row shows the whole loan repaying the full 250,000 of principal against roughly 205,015.60 of interest over its life, ending at a balance of 0.00.
Ask for the first year (Amortization tab). Leave P1 = 1 and P2 = 12 and press Compute range. The cards report the first twelve payments:
- The
PRINCIPALcard shows that only a small part of that first year - on the order of $4,000 - actually reduced the debt. - The
INTERESTcard shows the far larger share - roughly $11,000 - paid as interest. - The balance card, headed
PAYMENTS 1–12, shows you still owe close to $245,967 after a full year of payments.
That imbalance is the whole point of amortization: at the start of a loan you are paying the lender for the use of a large outstanding balance, so most of each payment is interest. To watch the mix shift, compute later ranges - 13–24, 25–36, and so on - and the PRINCIPAL card grows while the INTEREST card shrinks. You can also read the same story directly in the schedule on the right: scroll down and the PRINCIPAL and INTEREST figures in each row trade places as the years pass, with the BALANCE column marching toward zero.
(The precise figures come from the calculator once you compute; the round numbers above are given to show the shape of the result, not as exact outputs.)
Relationship to the TVM worksheet
The Amortization and TVM worksheets are two windows onto one loan. TVM is where you define the loan - enter what you know, solve for what you do not. Amortization is where you inspect it - the payment-by-payment schedule and the principal/interest/balance breakdown for any stretch of payments. Neither holds a separate copy of the numbers: change the loan on either tab (or from the calculator keypad) and both update together. The schedule you see on the Amortization tab is the very same schedule the TVM tab draws alongside its result; the range cards here are the piece TVM does not provide.
If a range result ever looks stale or has vanished, it is because the loan underneath it changed. Confirm the loan on the TVM tab, return to Amortization, and press Compute range again.
Related chapters
- The Financial calculator - the mode these worksheets live in, and how to switch between the calculator and the Worksheets view.
- The TVM worksheet - setting up and solving the loan that this worksheet breaks down.