Chapters
Breakeven and profit margin
Two of Castiel's Financial worksheets answer the everyday pricing questions a business asks: how many do I have to sell before I stop losing money? and what is my profit margin at this price? The Breakeven worksheet works out the sales volume at which revenue exactly covers cost, and the profit you make above it. The Profit Margin worksheet ties cost, selling price, and margin together, so you can fix any two and read the third. Both belong to the Financial calculator.
You reach them the same way. In Financial mode, switch the workspace from the keypad to the worksheet list with the Calculator / Worksheets toggle, then pick Breakeven or Profit Margin from the strip of worksheet tabs (the strip also holds TVM, Cash Flow, Amortization, Bond, Depreciation, and Interest Conv). This chapter covers the two pricing worksheets together, because they share a layout and are usually used side by side.
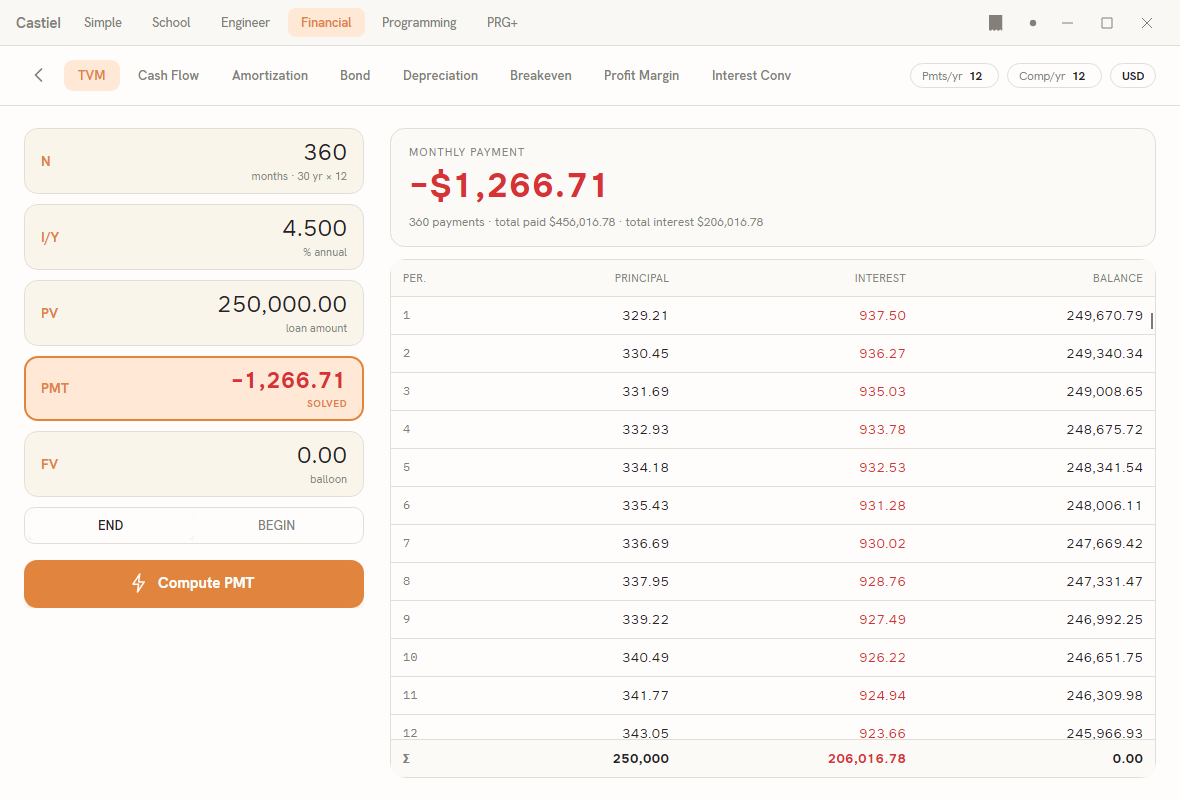
Every worksheet in this family follows one layout: a form down the left with a short two- or three-letter key beside each field and a plain-language label beneath it, a Compute button under the form, and a result card on the right that stays blank until you compute. The card shows a heading, one large headline figure, and a line of supporting detail beneath it. If a field is missing or a value cannot be worked out, a short message appears in red under the Compute button instead.
The Breakeven worksheet
Breakeven analysis rests on five quantities:
- fixed cost (
FC) - the cost you carry no matter how many units you sell (rent, tooling, a licence); - variable cost per unit (
VC) - what each additional unit costs you to make or buy; - unit price (
P) - what you sell each unit for; - quantity (
Q) - how many units you sell; - profit - what you keep after all costs.
These are bound together by one relationship: profit equals revenue minus total cost, or profit = (P − VC) × Q − FC. The breakeven point is the quantity at which that profit is exactly zero - the moment revenue has just caught up with cost. Below it you are making a loss; above it every further unit adds its P − VC (the contribution per unit) straight to profit.
The fields. The Breakeven form has four inputs:
| Key | Field | What to enter |
|---|---|---|
FC |
fixed cost | Your total fixed cost. |
VC |
variable cost per unit | The cost of one more unit. |
P |
unit price | The price you sell one unit for. |
Q |
quantity (for the profit figure) | A sales volume you want the profit worked out at. |
The first three fields describe your economics; Q is the volume you are testing. You do not enter a profit - the worksheet computes it. Press Compute and the result card reports three things at once:
- the breakeven quantity as the headline - the units you must sell to reach zero profit, worked out as
FC ÷ (P − VC); - the breakeven sales - the revenue at that quantity, in your selected currency;
- the profit at the quantity
Qyou entered.
Because breakeven divides the fixed cost by the contribution per unit, the unit price must be greater than the variable cost per unit. If P does not exceed VC, each sale loses money and there is no breakeven point to find; the worksheet reports the error rather than a meaningless figure.
Worked example. Suppose your fixed cost is 10,000, each unit costs 5 to make, you sell it for 15, and you expect to sell 2,000 units.
- Enter
10000inFC,5inVC,15inP, and2000inQ. - Press Compute.
The contribution per unit is 15 − 5 = 10. The headline reads 1,000 units - that is 10,000 ÷ 10, the volume at which you break even. The detail line shows breakeven sales of 15,000 (the 1,000 units at 15 each) and, at your entered volume of 2,000 units, a profit of 10,000 - the 1,000 units you sell beyond breakeven, each contributing 10.
Change any input and compute again to test a different scenario: a lower price shifts the breakeven quantity up, a smaller fixed cost brings it down.
The Profit Margin worksheet
Profit margin ties together three quantities: the cost (CST) you pay for an item, the selling price (SEL) you charge for it, and the gross margin (MAR), a percentage. Give the worksheet any two of the three and it solves for the third.
Margin versus markup. Both express the gap between cost and selling price as a percentage, but they divide it by different things, so they are not the same number:
- Margin is the profit as a fraction of the selling price:
MAR = (SEL − CST) ÷ SEL × 100. It answers "what share of the price is profit?" - Markup is the profit as a fraction of the cost:
(SEL − CST) ÷ CST × 100. It answers "how much did I add on top of cost?"
For the same pair of numbers, markup is always the larger figure, because cost is smaller than selling price. Buy at 100, sell at 125, and the 25 of profit is 20% of the 125 price (margin) but 25% of the 100 cost (markup). The worksheet works in margin; when it solves for margin it also reports the matching markup on the detail line, so you can read both from one calculation.
The fields and the solve direction.
| Key | Field |
|---|---|
CST |
cost |
SEL |
selling price |
MAR |
% gross margin |
Beneath the fields is a three-way selector - MARGIN, PRICE, COST - that chooses which quantity the worksheet computes. Whichever you pick becomes the output: you fill in the other two fields, press Compute, and the chosen field is filled in for you (marked SOLVED) and shown as the headline on the result card.
- MARGIN - enter cost and selling price; the worksheet returns the gross margin percent, with the equivalent markup on the detail line.
- PRICE - enter cost and a target margin percent; the worksheet returns the selling price you must charge to hit it.
- COST - enter selling price and a target margin percent; the worksheet returns the cost you would need to buy at.
Percentages are shown to three decimal places (for example 20.000 %), and prices in your selected currency.
Worked example. You buy an item for 100 and sell it for 125. What is your margin?
- Leave the selector on MARGIN.
- Enter
100inCSTand125inSEL. - Press Compute.
The MAR field fills with 20.000 and the result card headlines GROSS MARGIN 20.000 %, with markup 25.000 % on the detail line - the same 25 of profit, measured against the price and against the cost.
Now turn the question around. Say you want a 30% margin on that same 100 cost:
- Set the selector to PRICE.
- Enter
100inCSTand30inMAR. - Press Compute.
The worksheet solves for the selling price that yields a 30% margin - 142.857 in your currency - and marks the SEL field as SOLVED. Switch the selector to COST to run it the other way: fix the selling price and the margin, and read back the cost you can afford to pay.
Related chapters
- The Financial calculator - the mode these worksheets live in, and how to reach the worksheet list.
- Interest conversion - the nominal-to-effective rate worksheet on the same tab strip.