Chapters
The School apps
School mode is Castiel's classroom workspace. It is built for secondary and early-college study: a scientific calculator in the class of the Casio fx-CG100, surrounded by a set of purpose-built apps for graphing, statistics, algebra, geometry, and more. If you are a student learning a topic, or a teacher demonstrating one, School mode is the home you will spend most of your time in. Everyday calculating is only its front door; the depth is in the apps.
You reach School mode from the mode pill strip in the title bar at the top of the window. Selecting School opens the mode on its Home screen - the app launcher pictured below. From there you pick an app; the app fills the workspace, and the left rail stays with you so you can move between apps or return Home at any time.
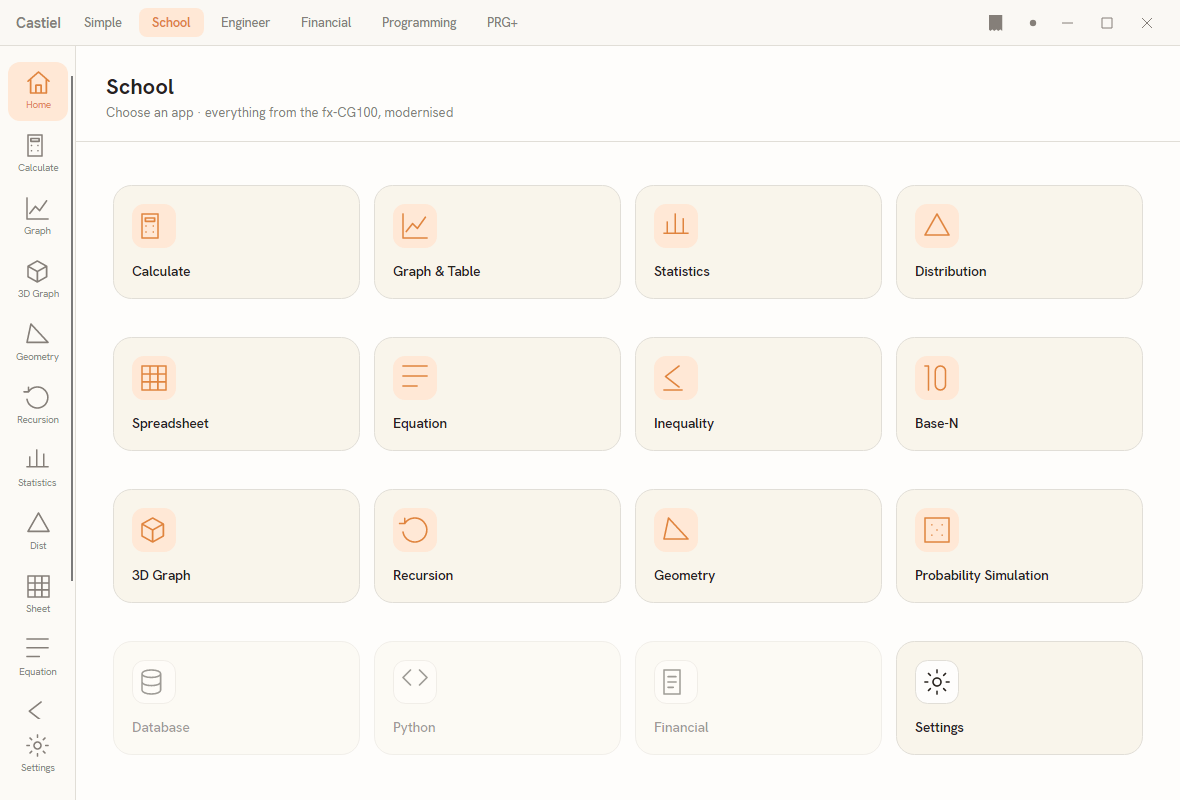
School mode is organised around two pieces of navigation that are always present: the apps rail down the left edge, and - on the Home screen - the launcher grid of app tiles filling the rest of the window. When you open an app, the launcher grid is replaced by that app's workspace, but the rail does not move. Every app you open shares one running paper tape, so a calculation made in one app is visible to the others.
The home launcher
The Home screen is a grid of tiles, one per app, laid out four to a row. Each tile shows the app's icon and name; hovering a tile shows a one-line description of what the app does. Click a tile to open that app in the workspace.
Reading the grid in row order, the tiles are:
| Tile | What the app is |
|---|---|
| Calculate | The scientific calculator: a Natural Textbook display over a keypad, for evaluating a single expression in exact form. |
| Graph & Table | Plot functions, trace along a curve, zoom, solve key points, and read a value table. |
| Statistics | Enter data into lists, then produce summaries, regressions, and statistical tests. |
| Distribution | Work with probability distributions - probability density, cumulative, and inverse - over a value or a list. |
| Spreadsheet | A formula grid with cell references and named variables. |
| Equation | Solve linear, quadratic, and polynomial equations, or find a root numerically. |
| Inequality | Solve inequalities and see the solution set drawn out. |
| Base-N | Calculate in binary, octal, decimal, and hexadecimal, with a bit inspector. |
| 3D Graph | Plot z = f(x, y) surfaces and view them under an orbiting camera. |
| Recursion | Explore recurrence sequences with tables and cobweb plots. |
| Geometry | Build dynamic-geometry constructions on an interactive canvas. |
| Probability Simulation | Run random experiments and compare experimental against theoretical probability. |
| Settings | Open the app settings (angle mode, number format, and more). |
Disabled tiles. Three tiles appear in the grid but are shown dimmed and do not respond to a click: Database, Python, and Financial. They mark apps that are planned but not part of this build. They are drawn so the full app set is visible; selecting one does nothing until it ships.
The apps rail
The rail is the narrow strip of icon buttons down the left edge of the window. It is present in every School app, not only on Home, so it is how you move around without going back to the launcher first. Each rail button carries a small icon and a short caption; hovering one shows the full app name and a one-line description, which is useful because the rail captions are abbreviated (the launcher grid uses the full names).
From top to bottom, the rail lists:
Home · Calculate · Graph · 3D Graph · Geometry · Recursion · Statistics · Dist · Sheet · Equation · Ineq · Base-N · Prob. Sim
and, pinned separately at the very bottom, Settings.
- Home takes you back to the launcher grid at any time.
- The middle entries each open their app in the workspace. The button for the app you are in is highlighted, so the rail always shows where you are.
- Settings sits apart at the foot of the rail. Selecting it opens the settings pane rather than swapping the workspace, so your current app stays where it is behind it. Angle mode and number format - the settings that shape what the calculator returns - live here.
If the list of apps is taller than the window, the rail scrolls with the mouse wheel; the Settings button stays pinned at the bottom while the app list above it scrolls.
The rail and the launcher offer the same apps by two routes: the rail is the quick jump you use while working, and the Home launcher is the full board you return to for the complete set (and for the descriptions on each tile). Note that a few apps live only on the launcher grid, not the rail - the disabled Database, Python, and Financial tiles among them.
One shared paper tape
Every School app writes to the same running paper tape. When you commit a calculation - pressing EXE in the calculator, or completing a step in another app - it is recorded on that shared tape, and it stays there as you move between apps. This means a result you produced in one app is available to the next, and the whole session's working is kept in one place rather than scattered per app.
The calculator surfaces this tape directly in its Show working panel, which renders your committed steps in textbook notation. For the full behaviour of the tape - reviewing, editing, correcting, and exporting your working - see the paper tape.
Related chapters
Each app has its own chapter:
- The School calculator - the everyday scientific workspace behind the Calculate tile.
- Graph & Table - plotting functions, tracing, and value tables.
- 3D Graph - plotting
z = f(x, y)surfaces. - Statistics - data lists, summaries, regressions, and tests.
- Distributions - probability density, cumulative, and inverse.
- Spreadsheet - the formula grid with variables and cell references.
- Equation - linear, quadratic, polynomial, and numeric solvers.
- Inequality - solving inequalities and drawing the solution set.
- Base-N - binary, octal, decimal, and hexadecimal with a bit inspector.
- Recursion - recurrence sequences, tables, and cobweb plots.
- Geometry - dynamic-geometry constructions.
- Probability simulation - random experiments and experimental probability.
- The paper tape - the shared working log that every app writes to.