Chapters
The Cash Flow worksheet
The Cash Flow worksheet is where you value an uneven stream of cash flows - an investment that costs something up front and then pays back different amounts over several periods. Unlike the TVM worksheet, which assumes one level payment repeated every period, the Cash Flow worksheet lets each period carry its own amount. You enter an initial outlay and a list of later flows, then ask two questions of them: what is the stream worth today at a rate you choose (Net Present Value), and what rate would make it break even (Internal Rate of Return).
Use it whenever you are weighing an investment or project: an initial cost followed by a run of returns, a piece of equipment with irregular yearly savings, or any "spend now, receive later" decision where the receipts are not all the same size. It is one tab of the Financial calculator's worksheets surface; you reach it by selecting Cash Flow in the worksheet tab strip, or with the Financial keypad's cash-flow keys.
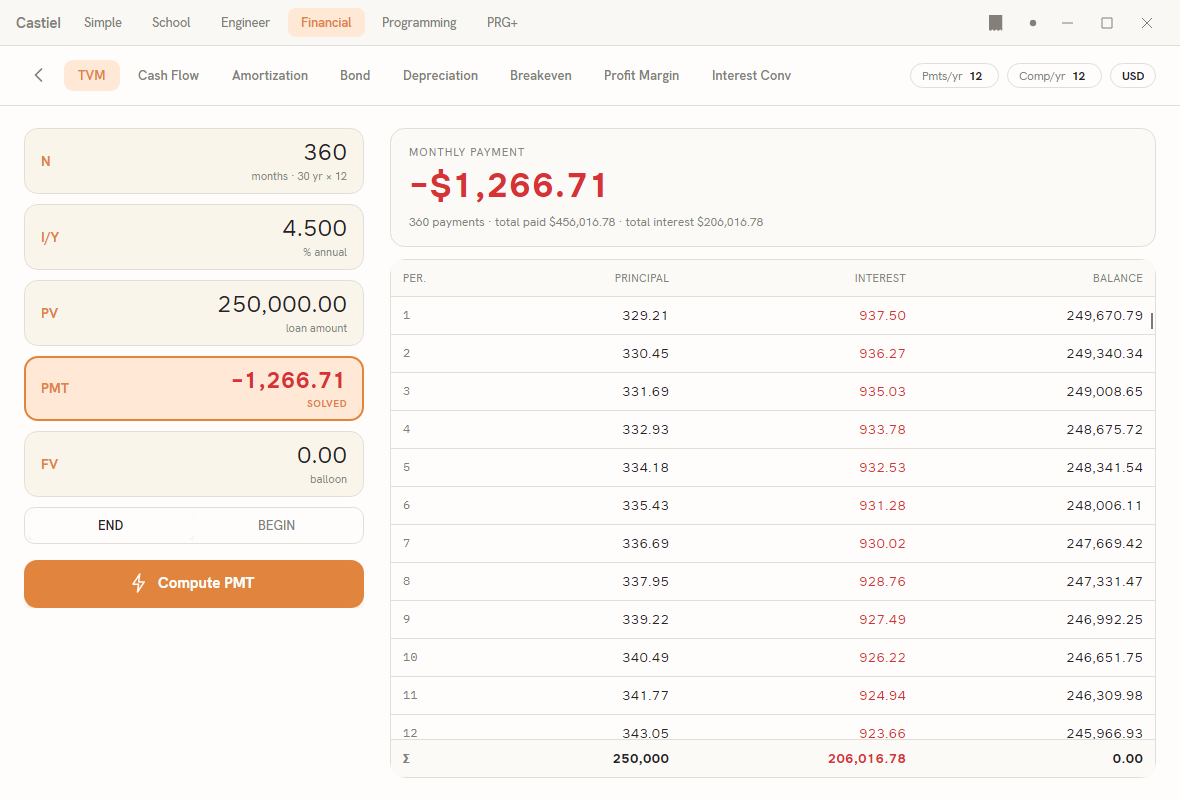
The worksheets surface is laid out the same way on every tab. A tab strip runs across the top - TVM, Cash Flow, Amortization, Bond, Depreciation, and the rest - with the Pmts/yr, Comp/yr, and currency chips at the right end. Below it, the tab body has two columns: an input form on the left where you build up the figures, and result cards on the right where the computed answers appear. The screenshot above shows the TVM tab; the Cash Flow tab keeps the same shape, with the cash-flow register on the left and NPV / IRR cards on the right. The Cash Flow tab opens with a small worked series already filled in, so you can compute straight away and see how the register behaves before entering your own numbers.
The cash-flow register
The left column is the register: the ordered list of money moving in and out, period by period. It has three parts stacked top to bottom - the initial flow, the series of later flows, and the discount rate.
CF0 - the initial flow. The first field is CF0, the cash flow at time zero: the money you put in (or take out) at the very start, before any periods have passed. Its caption reads initial flow · outlay negative. For a typical investment this is your up-front cost, entered as a negative number.
The grouped flows. Below CF0 is the series of later flows. Each row is a group - an amount together with a count of how many consecutive periods it repeats:
- The amount field (captioned
amount per period) is what you receive or pay in each period of the group. - The count field (captioned
× periods) is how many periods in a row that same amount occurs. It must be a whole number of at least1.
Grouping is what keeps the list short. If a project pays 500 for three periods running, you enter one row - 500 with a count of 3 - rather than typing 500 three times. Rows are labelled C01, C02, C03 and so on down the list, in the order the flows occur. Add a row with the + Add cash flow button beneath the list; remove one with the small cross button at the right end of its row. The labels renumber themselves to stay in sequence.
I - the discount rate. The last field is I, captioned % per period · NPV discount. This is the rate the NPV computation discounts by. Note the wording: it is a rate per period, matching the periods your flows are counted in - not necessarily an annual rate. If your flows are yearly, this is a yearly rate; if monthly, a monthly rate. Enter it as a plain percentage (type 10 for ten percent, not 0.1).
The sign convention
Every figure in the register follows one rule, the same rule the whole Financial calculator uses:
- Money coming to you is positive. Returns, receipts, income, and inflows are entered as positive amounts.
- Money leaving you is negative. Costs, outlays, and payments are entered as negative amounts.
Because an investment almost always starts with money going out, CF0 is usually negative and the later flows positive. This is why the CF0 caption says outlay negative - it is a reminder to enter your starting cost with a leading minus sign. Getting the signs right is what makes the two computes meaningful: NPV and IRR only have their usual interpretation when the stream contains both signs (money out, then money in). Type the minus with either the keyboard hyphen or the ± sign; both are accepted.
Computing Net Present Value
Net Present Value answers: if I discount every future flow back to today at rate I and add them all up, together with the initial flow, what is the whole stream worth right now? A positive NPV means the stream is worth more than it costs at that rate - the investment clears the bar. A negative NPV means it falls short.
Fill in CF0, the flow rows, and the discount rate I, then press Compute NPV. The NET PRESENT VALUE card appears on the right with the figure as a currency amount. The line beneath it states the rate and the horizon it was computed over - for example at 10 % per period · 3 periods, where the period count is the sum of every group's count. A negative NPV is shown in the negative colour so an unprofitable result reads at a glance.
Reading the result: compare the NPV against zero. Above zero, the stream earns more than the discount rate you set; below zero, it earns less. To test the same stream at a different required return, change I and press Compute NPV again - the card updates.
Computing Internal Rate of Return
Internal Rate of Return turns the NPV question around. Instead of choosing a rate and reading the value, IRR finds the rate at which the value is exactly zero - the break-even discount rate, the return the stream earns on its own. The card's own caption states this plainly: it zeroes the NPV of this register.
Press Compute IRR. The INTERNAL RATE OF RETURN card appears with the rate as a percentage and the line per period · zeroes the NPV of this register beneath it. IRR does not use the I field at all - it solves for a rate rather than reading one - so you can compute IRR whether or not you have entered a discount rate.
Reading the result: IRR is a rate per period, on the same footing as the flows. Compare it against the return you require. If the IRR is above your required rate, the investment beats your bar; if below, it does not. The two computes agree at that crossover: at a discount rate equal to the IRR, the NPV would be zero.
When IRR does not converge
IRR is found by iteration - the calculator searches for the rate that zeroes the value. For a well-formed investment (an initial outlay followed by inflows, so the stream changes sign) a single sensible rate exists and the search settles on it. Two situations need care:
- No sign change. If every flow has the same sign - all money out, or all money in - there is no break-even rate to find, because the value can never cross zero. The stream has no meaningful IRR.
- The search does not settle. For an awkward stream the iteration may fail to home in on a rate. When that happens the calculator does not print a made-up number; it shows a short message in place of the result,
The solver did not converge for these inputs, so you know the figure is unavailable rather than wrong.
A stream with several sign changes can, in principle, break even at more than one rate. In that case the calculator reports a single, consistent answer - the rate closest to zero - rather than listing every possibility. If an IRR looks surprising, NPV is the reliable cross-check: choose your own required rate, compute the NPV, and read profitability directly from its sign.
This worksheet is deliberately focused on the two headline measures, NPV and IRR. For a level-payment loan or annuity - a fixed payment repeated every period, with amortization schedule - use the TVM worksheet instead.
A worked example
Take the series the tab opens with: you invest 1,000 up front and receive 500 at the end of each of the next three periods. Is it worth doing, and what return does it earn? Assume a required rate of 10 % per period.
- In
CF0, enter the outlay as a negative amount:−1000. - In the first flow row (
C01), enter the amount500, and set its count to3- one group standing for all three periods. - In
I, enter the discount rate10. - Press
Compute NPV.
The NET PRESENT VALUE card shows about $243.43, with the line at 10 % per period · 3 periods beneath it. The value is positive, so at a required return of 10 % the three payments of 500 are worth about 243 more than the 1,000 they cost - the investment clears the bar.
Now press Compute IRR. The INTERNAL RATE OF RETURN card shows about 23.38 % per period. That is the rate at which the stream exactly breaks even: discount the three 500s at 23.38 % and their present value equals the 1,000 outlay, leaving an NPV of zero. Because 23.38 % comfortably exceeds the 10 % you required, the two measures tell the same story from different angles - the positive NPV and the above-hurdle IRR both say the investment is worthwhile.
To explore further, change I to 23.38 and press Compute NPV again: the NPV collapses to essentially zero, confirming that the IRR is exactly the rate at which the stream neither gains nor loses.
Where the results live
The Cash Flow worksheet is a self-contained calculating surface. The register you build and the NPV / IRR cards it produces stay on the worksheet - they are a scratchpad for valuing one stream, not entries committed to the shared running tape. Change any figure and recompute to revalue the same stream; switch to another tab and back and your register is still there. For the everyday calculator whose steps do accumulate on the paper tape, see the paper tape.
Related chapters
- The Financial calculator - the mode these worksheets belong to, and the full tab strip.
- The TVM worksheet - level payments, present and future value, and the amortization schedule.
- The paper tape - the shared running log used by the everyday calculator surfaces.