Chapters
The Depreciation worksheet
The Depreciation worksheet builds a year-by-year depreciation schedule for a fixed asset: how much of its value is written off each year, what it is worth on the books at the end of each year, and how much is still left to depreciate. You reach it from Financial mode: along the worksheet tab strip at the top (TVM, Cash Flow, Amortization, Bond, Depreciation, Breakeven, Profit Margin, Interest Conv), select Depreciation - it is the fifth tab.
Use this worksheet whenever you need to spread the cost of an asset - a machine, a vehicle, equipment - across its useful life. You enter three numbers about the asset, choose a method, and the full schedule appears at once; there is no separate "compute" step, and every figure updates live as you edit. It mirrors the depreciation worksheet on a financial calculator such as the TI BA II Plus.
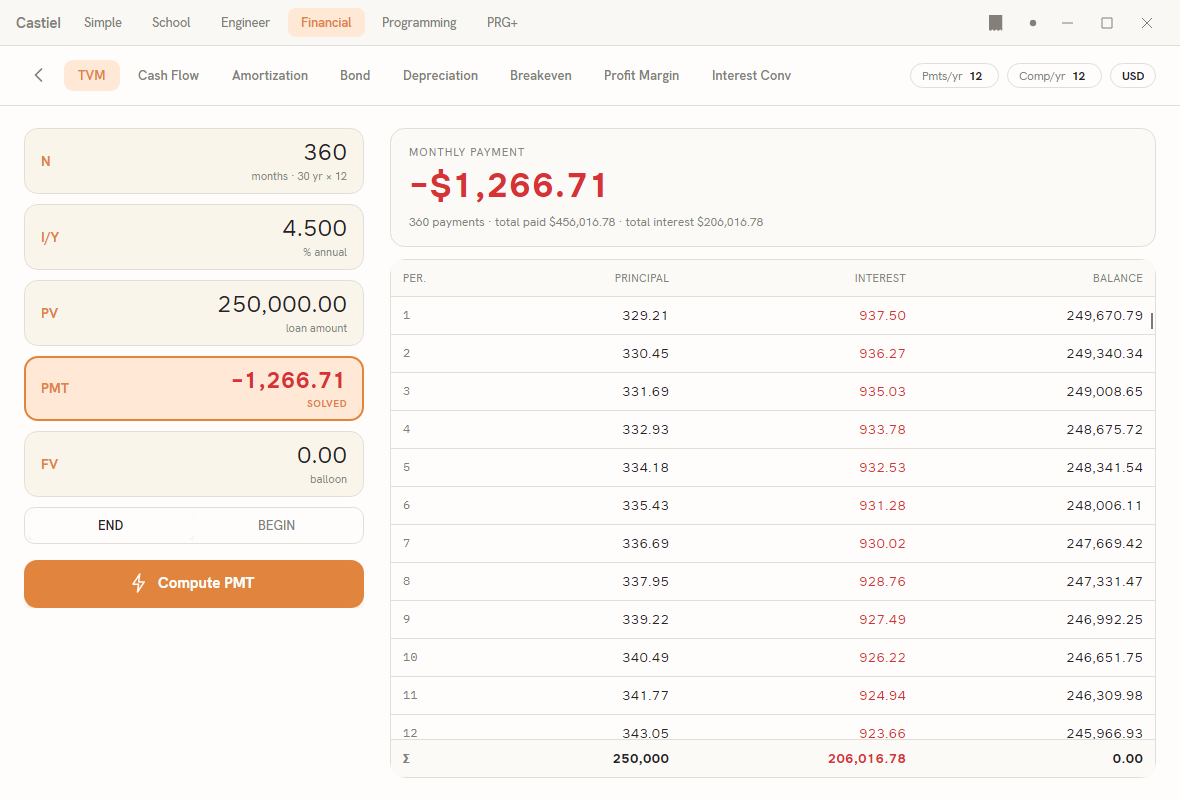
The window has two columns. On the left is the input form - a short stack of keyed fields (CST, SAL, LIF, and, for one method, DB%), a year selector (YR), and the SL / SYD / DB method control - with a result card beneath it summarising the selected year. On the right is the schedule table: one row per year, with the selected year highlighted. The screenshot above shows the sibling TVM tab, which shares this exact two-column layout - a form on the left and a computed table on the right; the Depreciation tab follows the same design.
The three methods
The method control is a segmented switch with three options. Each one distributes the same total depreciable amount - the cost less the salvage value - but on a different timetable.
| Button | Method | How it spreads the cost |
|---|---|---|
SL |
Straight line | Equal amounts every year. The depreciable amount is divided evenly across the life. |
SYD |
Sum of the years' digits | Front-loaded on a fixed fractional schedule. Early years take a larger share, later years a smaller one, using the years' digits as weights. |
DB |
Declining balance | Front-loaded by a fixed percentage of the remaining book value each year, so the amount tapers off as the book value falls. |
Straight line is the simplest and most common. Sum of the years' digits and declining balance are both accelerated methods: they write off more in the early years, which many assets (and many tax rules) call for. Choosing a method redraws the whole schedule immediately.
The inputs
The left form uses short keyed labels, in the style of a financial calculator. Type a value into a field and the schedule recomputes as you go.
| Key | Field | What to enter |
|---|---|---|
CST |
asset cost | The purchase cost (capitalised cost) of the asset. |
SAL |
salvage at end of life | The value you expect the asset to retain at the end of its useful life. |
LIF |
useful life · years | The number of years over which to depreciate the asset. |
DB% |
declining-balance factor | The declining-balance rate, as a percentage. 200 is double-declining balance; 150 is 150% declining balance. |
YR |
selected year | The year the result card describes (see Stepping through the years below). |
The DB% field appears only when the DB method is selected - it is meaningless for straight line and sum of the years' digits, so it is hidden for those two. Its on-screen hint, 200 = double, is a reminder that the default 200 gives the double-declining-balance schedule.
If a required field is empty or not a number, the schedule is replaced by a short prompt (for example, Enter the cost, salvage and life) until you complete the inputs. The life must be between 1 and 200 years.
Reading the schedule
The table on the right has four columns, one row per year of the asset's life:
| Column | What it shows |
|---|---|
YEAR |
The year number, counting from 1. |
DEPRECIATION |
The amount written off in that year. |
BOOK VALUE |
The asset's remaining carrying value at the end of that year - the cost less all depreciation taken so far. |
DEPRECIABLE |
The amount still left to depreciate at the end of that year - the book value less the salvage value. |
Read across a row to see the state of the asset at the close of that year; read down the DEPRECIATION column to see the write-off timetable the method produces. The BOOK VALUE column falls year on year, ending at the salvage value; the DEPRECIABLE column falls to zero in the final year, when the asset has been written down to its salvage value.
The result card. Beneath the form, a card restates the currently selected year in words: a YEAR n DEPRECIATION heading, the year's depreciation figure in large type, and a sub-line giving the method name together with that year's book value and remaining depreciable amount. It is the same numbers as the highlighted schedule row, pulled out for quick reading.
Stepping through the years
There are two ways to move the selection from year to year:
- Tap a row in the schedule. That year becomes the highlighted row, and the result card updates to describe it. The
YRfield follows along to show the selected year number. - Type a year into
YR. The matching row highlights and the result card updates to match.
The two are linked - tapping a row sets YR, and editing YR moves the highlight - so you can drive the selection from whichever is closer to hand. Stepping the selection changes only which year is described; it never changes the schedule itself.
Worked example: straight line versus declining balance
The worksheet opens on a ready-made asset so you can see a schedule immediately: cost 10,000, salvage 1,000, life 5 years. Here is how its first year differs between the two methods.
Straight line. With SL selected, the depreciable amount - cost less salvage, 10,000 − 1,000 = 9,000 - is spread evenly over five years, so every year writes off 1,800. The schedule reads:
YEAR |
DEPRECIATION |
BOOK VALUE |
DEPRECIABLE |
|---|---|---|---|
| 1 | 1,800 | 8,200 | 7,200 |
| 2 | 1,800 | 6,400 | 5,400 |
| 3 | 1,800 | 4,600 | 3,600 |
| 4 | 1,800 | 2,800 | 1,800 |
| 5 | 1,800 | 1,000 | 0 |
The book value walks down in equal steps and lands exactly on the 1,000 salvage value; the remaining depreciable amount reaches 0.
Declining balance. Now tap DB. The DB% field appears showing 200 (double-declining balance), which for a five-year life gives a rate of 200 ÷ (100 × 5) = 40% of the remaining book value each year. Year 1 applies that rate to the full cost: 10,000 × 40% = 4,000. The first schedule row becomes:
YEAR |
DEPRECIATION |
BOOK VALUE |
DEPRECIABLE |
|---|---|---|---|
| 1 | 4,000 | 6,000 | 5,000 |
The comparison. In year one, straight line writes off 1,800 while double-declining balance writes off 4,000 - more than twice as much. That is the point of an accelerated method: it recovers cost faster in the early years, with correspondingly smaller amounts later as the declining balance shrinks. Over the whole life both methods write the asset down to the same 1,000 salvage value; they only differ in the timing.
Change CST, SAL, LIF, or DB% and both schedules redraw at once, so you can try the same asset under each method simply by tapping between SL, SYD, and DB.
Related chapters
- The Financial calculator - the Financial mode and its full set of worksheet tabs.
- The TVM worksheet - time value of money: loans, savings, and annuities.