Chapters
The Programming debugger
The debugger lets you run a sequence one statement at a time and watch what it does. Instead of pressing Run and seeing only the final answer, you pause execution wherever you choose, step forward statement by statement, and inspect every variable as it changes. It is the tool you reach for when a sequence produces the wrong result and you need to see exactly where it goes astray.
You open the debugger from the Debug tile on the Programming apps rail down the left edge. Selecting it switches the centre panel to the Listing view - the debugger always works against the code listing, never the blocks or the recorder - and replaces the output console on the right with the debugger's own panels. To debug a sequence, open it in Programming mode, select Debug on the rail, and start a run.
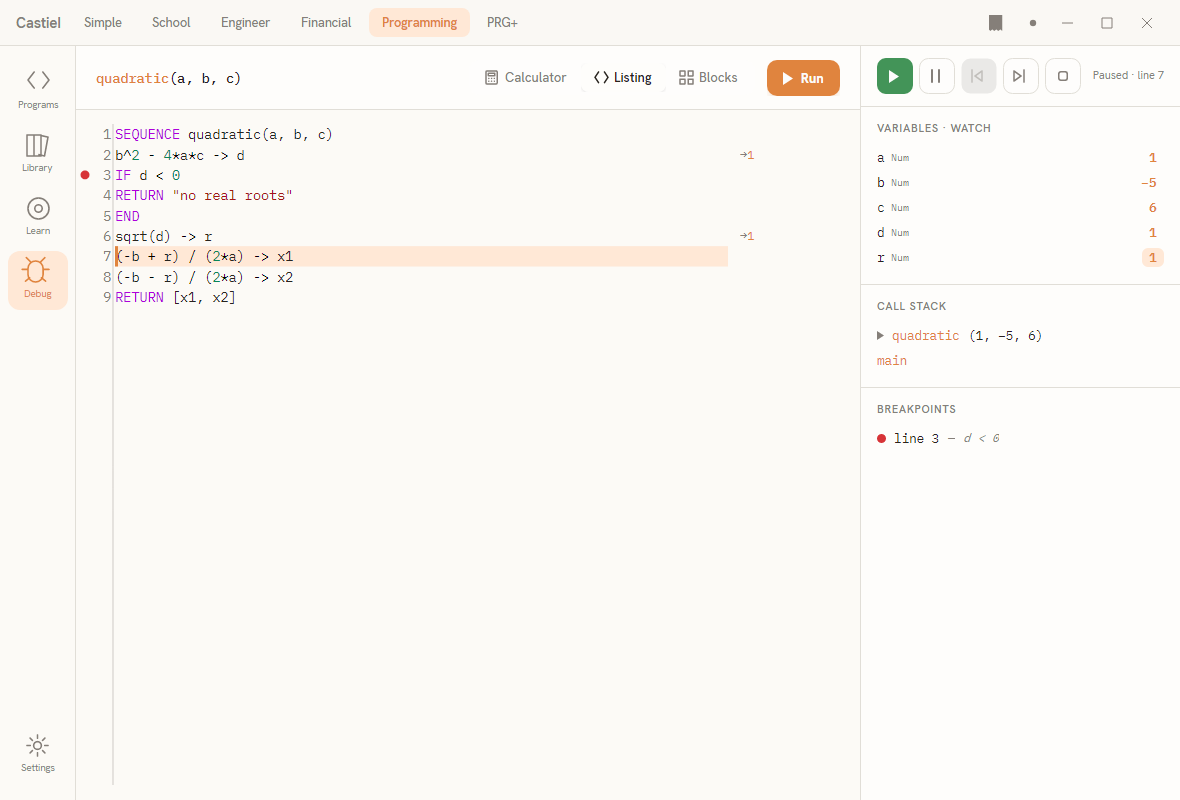
The Debug surface has three parts. The apps rail on the far left (Programs, Library, Learn, Debug, Settings) with Debug lit. The listing in the centre: numbered source lines, a breakpoint gutter to the left of the numbers, and a slim preview column on the right that shows the value each line produced. The debugger pane on the right, a fixed 320-pixel column holding the step toolbar and the Variables · Watch, Call Stack, and Breakpoints panels stacked top to bottom.
Starting a debug run
There are two ways to begin, and they differ only in whether the run pauses.
Run to completion. The Run button in the surface header (or F5) validates the current sequence, then runs it straight through. The executing line still highlights as it goes and any breakpoints you have set still pause it, but if you have set no breakpoints the sequence runs to the end without stopping. Use this to confirm a fix, or to run up to the first breakpoint.
Step from the start. The green Go button on the debugger toolbar, pressed while nothing is running, starts a stepped run: the sequence pauses before its first statement and waits for you. From there you advance one statement at a time. This is the mode you want when you are hunting a problem and do not yet know which line is at fault.
Before either kind of run, the sequence is validated. If the listing still has errors, the run does not start - the error squiggles and the Problems panel already show what needs fixing. A sequence that takes inputs (a sequence declared as quadratic(a, b, c), for example) is run with the test values you have supplied, and those values appear as the arguments in the call stack.
The step controls
The toolbar across the top of the debugger pane holds five controls, followed by a status label. In the screenshot the label reads Paused · line 7.
| Control | Icon | What it does |
|---|---|---|
| Go | green triangle | Starts a stepped run when idle; resumes a paused run to the end (or to the next breakpoint) once one is under way. |
| Pause | two bars | Interrupts a running sequence so it parks before its next statement. From there you can step. |
| Back step | skip-back | Steps backwards to the previous statement. Not available yet - the button is shown but disabled. |
| Step | skip-forward | Advances exactly one statement, then pauses again. This is your main tool while paused. |
| Stop | square | Ends the run immediately. The sequence reports as stopped rather than completed. |
The status label to the right of the buttons tells you the run state at a glance: it shows Running while the sequence is executing freely, Paused · line N when it is parked before line N awaiting your next step, and it clears when nothing is running.
Two of these deserve a note. Pause and Step both leave you parked between statements, but Pause is how you break into a run that is already going, while Step is how you move on once broken in. Go does double duty: idle, it launches a stepped run; paused, it lets the rest of the sequence run out. Back step is a planned addition; until it ships, you re-run from the top to revisit an earlier statement.
Breakpoints
A breakpoint marks a line where you want the run to stop, so you can jump straight to a suspect statement without stepping through everything before it.
Setting one. Click in the breakpoint gutter - the narrow strip immediately left of the line numbers - on the line you want. A red dot appears there. Clicking the dot again removes it. You can also toggle a breakpoint on the line holding the text caret with F9. Breakpoints toggle on and off; there is no separate enabled-but-inactive state.
The Breakpoints panel. Every breakpoint you set is listed at the bottom of the debugger pane under Breakpoints, each as a red dot, its line label, and a snippet of that line's source - ● line 3 — d < 0 in the example. The list stays sorted by line number, so it doubles as a map of where the run will stop.
When a stepped or free run reaches a breakpointed line, it pauses before executing that statement, exactly as if you had stepped to it. The status label switches to Paused · line N and the line highlights. From there, Step to move on one statement at a time, or Go to continue to the next breakpoint or the end.
The current line and per-line previews
While a run is paused or stepping, the statement about to execute is highlighted in the listing with a soft accent band and an accent bar down its left edge. That highlight is the single most useful thing on screen: it is the sequence's program counter, showing you precisely where execution has reached.
The preview column on the right of the listing shows the value each line produced on its most recent run, written as → followed by the value. In the screenshot, lines 2 and 6 each show →1: line 2 computed the discriminant d as 1, and line 6 computed r as 1. The previews fill in as the run reaches each line, so stepping forward is a good way to watch intermediate results appear one by one, right beside the code that made them.
Variables and Watch
The Variables · Watch panel at the top of the debugger pane lists every variable currently in scope, refreshed before each statement runs. Each row shows the variable's name, a dim type tag, and its current value. The type tag is one of Num (any number), Text, Bool, or Bag (a list or collection).
When a variable's value changes from one step to the next, its value is drawn in an accent-soft pill so the change catches your eye. In the screenshot, r carries that pill because the step that just ran assigned it. This is what makes stepping productive: press Step, and the one or two values that the new statement touched light up, while everything unchanged stays quiet.
You can also pin a watch on a variable by name. A watched variable tracks its current value the same way, and reads <undefined> until the run reaches a point where that variable has a value.
The call stack
The Call Stack panel shows the chain of sequences currently executing, innermost first. The top frame is the sequence under debug together with the inputs it was called with - ▸ quadratic (1, −5, 6) in the example - and beneath it sits main, the base frame. A triangle marks the active (top) frame. When one sequence calls another, the called sequence appears above its caller; as calls return, frames drop off. Reading the stack top to bottom tells you how the run arrived at the line it is on.
The console
While you are editing and running in the ordinary Listing view, the right-hand column is an output console, headed Output · Console. A run writes three kinds of line there: a call header naming the sequence and its arguments, one line for each value the sequence emits, and a closing status - completed when the run finishes, or stopped if you ended it with Stop. A failed run shows the error in place of the status.
Switching the rail to Debug swaps this console for the debugger's panels, so the two are never on screen at once. On the Debug surface, values the sequence prints or displays go to the shared paper tape instead, and the per-line preview column carries the intermediate results.
A worked example
This is the quadratic(a, b, c) sequence from the screenshot, which solves a·x² + b·x + c = 0. Run with a = 1, b = −5, c = 6, it should return the roots of x² − 5x + 6, namely 2 and 3. Suppose you want to watch it compute the square root and the first root.
- Open the sequence in Programming mode and select Debug on the apps rail. The listing appears with the debugger pane beside it.
- In the breakpoint gutter, click beside line 3 (
IF d < 0). A red dot appears, andline 3is listed under Breakpoints. - Press Go. The run starts, executes line 2 (
b^2 - 4*a*c -> d), and pauses at the breakpoint on line 3. The status readsPaused · line 3, line 3 is highlighted, and the preview column shows→1on line 2. In Variables · Watch,dnow shows1with the accent pill, because it just changed. - Because
dis1- not negative - theIFwill fall through. Press Step to advance. The discriminant is non-negative, so execution skips the "no real roots" branch and moves toward line 6. - Press Step again to run line 6 (
sqrt(d) -> r). The status advances, line 6's preview shows→1, andrappears in the watch with the accent pill: the square root has been taken. - Press Step once more to run line 7 (
(-b + r) / (2*a) -> x1). The highlight moves to line 7, andx1computes to3- the first root. - Press Go to let the rest of the sequence run out. Line 8 computes
x2as2, line 9 returns both roots, and the run completes.
Stepping through this way, you have seen each intermediate value appear the moment its line ran, and you have confirmed the sequence takes the correct branch at the IF. Had a value come out wrong, the highlighted line and the changed-value pill would have pointed straight at the offending statement.
Related chapters
- The Catena listing - writing and editing the code the debugger runs.
- Programming overview - the modes, the apps rail, and the recorder-blocks-listing views.
- The Catena language - the statements, variables, and control flow you are stepping through.