Chapters
The Listing view
The Listing view is the text editor for a Catena sequence: your program written out as lines of code, exactly as it will run. It is one of the three ways to look at the same sequence in Programming mode, and it is the source-of-truth view - the plain text underneath both the visual Blocks and the step-by-step Recorder. You reach it from the Listing button in the segmented view switcher at the top of the Programming surface (Calculator / Listing / Blocks), or by pressing Ctrl+2.
Use the Listing view when you want to read or write a sequence directly, hunt down an error, or set breakpoints before stepping through a run. It is the working surface for authoring by hand and for debugging. For an overview of what sequences are and how the three views relate, see Programming overview; for the drag-and-drop editor, see Blocks; for running a sequence line by line, see Debugger.
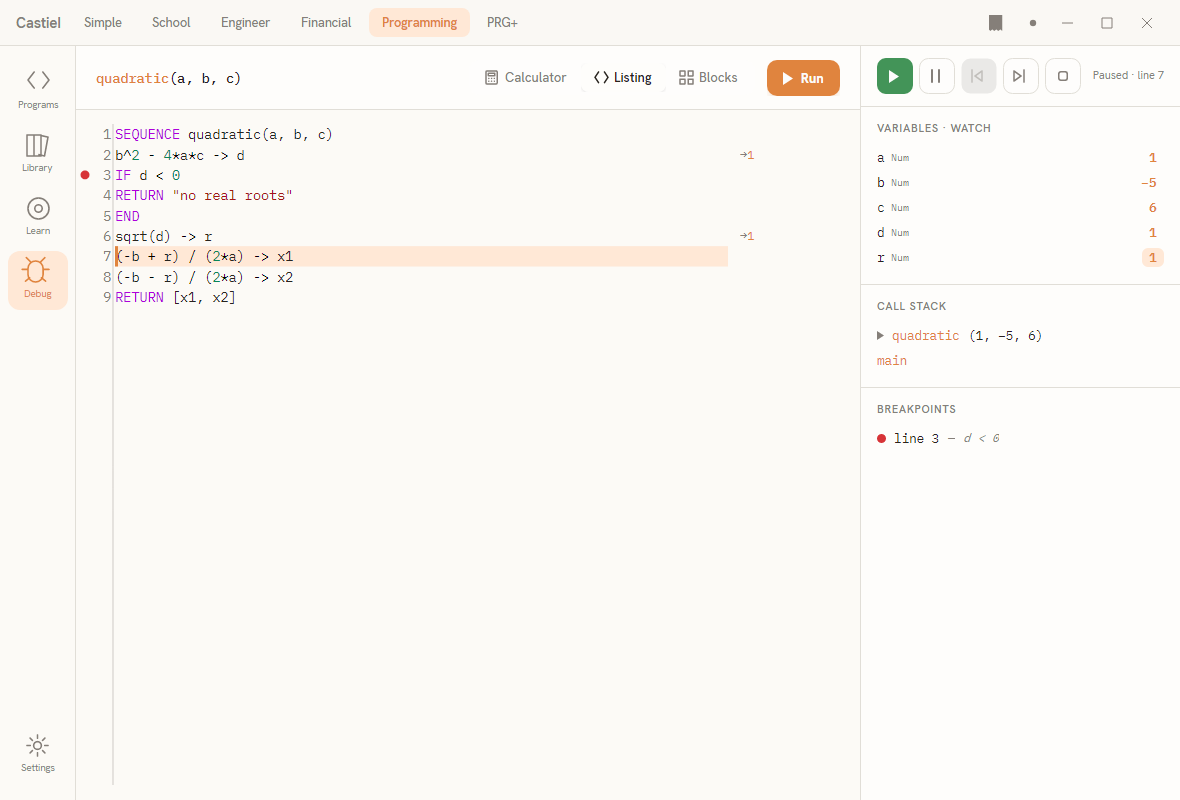
The editor fills the centre of the surface. Down its left edge sit the breakpoint gutter and the line numbers; the code itself occupies the main column in a monospaced font; and a slim value column runs down the right edge, showing the computed value of each line after a run. When you switch the left rail tile to Debug, the Listing view takes over the surface and the debugger panel opens on the right, as shown above.
The editor
Line numbers. Every line is numbered down the left margin in a dim tint. The numbers are for reference - they are what breakpoints, the current-line highlight, and diagnostics all point at, and what the debugger's status reads ("Paused - line N"). They are not editable; they renumber themselves as you add or remove lines.
Typing Catena code. The main column is a full code editor. Type your sequence one statement per line, using the Catena language: prompts, displays, stores and recalls, labels, and expressions. Catena keywords and values are colour-coded as you type, so structure is easy to scan. This chapter keeps the language itself light - for what the words mean and how to write them, see The Catena language. Standard text editing applies: the caret moves with the arrow keys, Ctrl+C / Ctrl+X / Ctrl+V copy, cut, and paste text, and the editor scrolls when the sequence outgrows the window.
The value column. The narrow column on the right shows, for each line, a small → followed by the value that line produced the last time the sequence ran. It sits beside the line that made it, so you read a sequence and its results together, the way a notebook shows a result under each cell. A line that has not run, or that produces no value, simply shows nothing in the column. The values come from the debugger: run or step through the sequence and the column fills in; the previews stay aligned with their lines as you scroll.
Diagnostics
As you type, Castiel re-checks the sequence in the background and underlines anything it cannot make sense of. The underline is a coloured wavy line beneath the exact span of source it objects to, colour-coded by how serious the problem is:
| Underline | Meaning |
|---|---|
| Red | An error - the sequence will not run until it is fixed (for example a misspelled keyword or an unclosed bracket). |
| Amber | A warning - the sequence can still run, but something looks suspect and is worth a second look. |
| Blue | An information note - a hint or advisory, nothing blocking. |
The check runs a moment after you stop typing, not on every keystroke, so the underlines settle rather than flicker while you work. Because the underline marks the precise span, you can see at a glance which token is at fault rather than just which line. Fix the text and the underline clears on the next check.
The current-line highlight
While the debugger is paused, the line it is about to run is highlighted with a soft accent band across the full width of the editor and a solid accent bar down its left edge. This is the "you are here" marker: it moves down the sequence as you step, so you always know which line is next. When nothing is running the highlight is hidden. It is driven entirely by the debugger - see Debugger for stepping, pausing, and the run controls.
Breakpoints
A breakpoint tells the debugger to stop at a line so you can inspect what is happening there. You set them in the Listing view, in the gutter to the left of the line numbers.
- Click the gutter cell beside a line to place a breakpoint; a round red dot appears there. Click the dot again to remove it.
- Or put the caret on the line and press
F9to toggle a breakpoint at that line without reaching for the mouse.
The dots are markers, not stops in themselves - they take effect when you run under the debugger, which pauses as it reaches each breakpointed line. The full set of breakpoints is also listed in the debugger's Breakpoints panel, each with a snippet of its line. Setting breakpoints is the usual first step before a debugging run: mark the lines you care about, then run and let the debugger bring you to them.
A worked example
Type a short two-line sequence into the editor and watch the value column fill in:
A = 6 * 7
DISPLAY A- Switch to the Listing view (
Ctrl+2). - On the first line, type
A = 6 * 7. As you type it is colour-coded; if you leave a bracket open or misspell a keyword, a red wavy underline appears under the offending span until you correct it. - On the second line, type
DISPLAY A. - Run the sequence (from the debugger, or press
F5).
After the run, the value column shows → 42 beside the first line, where A was assigned, and the same value beside the DISPLAY line. If you set a breakpoint on the second line first - click its gutter cell, or press F9 with the caret there - the run pauses on that line with the current-line highlight across it, and you can read the value column and the debugger's variable panel before letting it continue.
Staying in sync with Blocks and the Recorder
The three views are three windows onto one sequence, not three separate copies. The Listing text is the canonical form: when you record steps in the Recorder or arrange blocks in Blocks, the underlying sequence changes and the Listing updates to match, so the code you see here is always the real sequence. Switch views from the segmented control in the surface header (Calculator / Listing / Blocks), or with Ctrl+1, Ctrl+2, and Ctrl+3. Switching the left rail tile to Debug always brings up the Listing view, because line-by-line debugging happens against the code.
Editing in one view is reflected in the others when you switch back. This lets you work whichever way suits the task - build the shape of a program with blocks, then drop into the Listing to fine-tune a line - and trust that all three stay describing the same sequence.
Related chapters
- Programming overview - the three views, the apps rail, and how a sequence is put together.
- Blocks - building the same sequence as visual blocks.
- Debugger - running, pausing, stepping, and reading variables.
- The Catena language - the syntax of the code you type into the Listing.